Chrome OS has a built-in Diagnotisic tool that can run tests on your Chromebook’s battery, network connection, CPU, and memory. These test results will show you the health of your Chromebook’s main components. The diagnostic tool can also provide a live snapshot of how your CPU is performing.
To open the Diagnostic tool, press the Ctrl + Search (magnifying glass) + Esc keys.
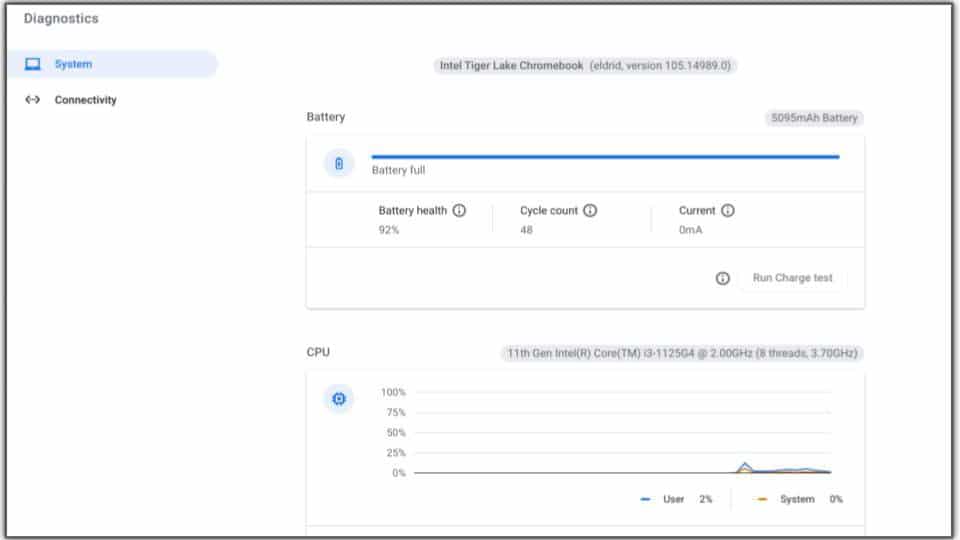
How To Test Your Chromebook’s battery
There are 2 battery tests
- Charge Test – available when your Chromebook is connected to a power charger
- available only when charging your Chromebook and the battery is less than 100%
- Discharge Test – available when your Chromebook is running on battery power
Click Run Charge Test or Run Discharge Test to test your battery.
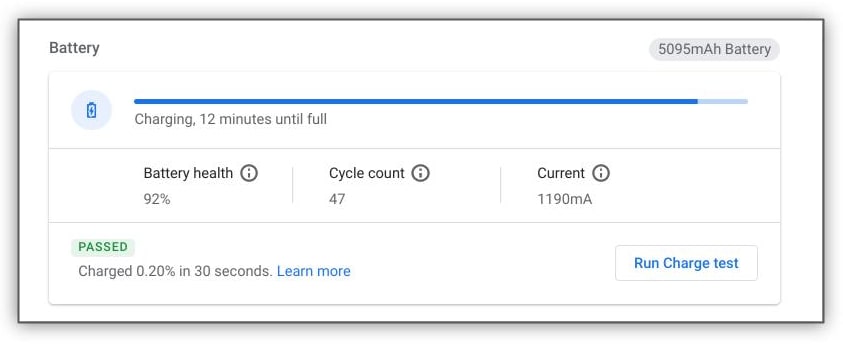
As with all rechargeable batteries, your battery condition will lessen over time. The example shows my Chromebook’s battery health at 92%. I’ve had this Chromebook for about 6 months. The battery test also shows the following information
- Battery capacity (unlabeled) = 5095mAh
- Cycle count = 47
- number of full charging cycles completed
- Current = 1190mA
- the current rate of charging or discharging
How To Test Your Chromebook’s CPU
Your Chromebook’s CPU or Central Processing Unit is often referred to as the brain of your Chromebook. It’s health and components have a large impact on the speed of your Chromebook.
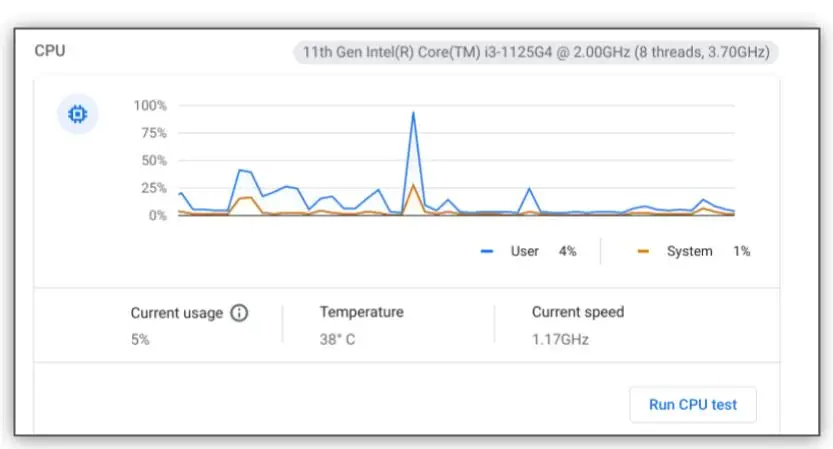
If your Chromebook begins running slow, it may be due to your processor being unable to keep up with everything it is doing. You quickly make that determination by opening the Diagnostic tool and looking at the real-time CPU usage graph. You can open the Diagnostic tool by pressing the Ctrl + Search (magnifying glass) + Esc keys.
It is normal to see spikes on the graph, even spikes that reach 100%. However, if your CPU flatlines at 100% or spends most of its time at 100%, your slowness is likely due to maxing out your CPU performance. This doesn’t mean your CPU is damaged or bad, there are a few things you can do to lessen your CPU load, which I cover in my Slow Chromebook? Let’s Fix It Fast! post.
The real-time CPU graph divides usage into two categories.
- User – What you are doing that uses the CPU
- opening and using apps
- opening using new tabs
- playing games
- listening to music
- watching videos
- System – tasks the OS or operating system is doing
- Installing updates
- background tasks related to what you are doing
The real-time view also provides additional information
- Current usage – your CPU load right this second. This is also represented at the far right of the graph.
- Temperature – your CPU’s temperature in degrees Celcius
- Current speed – your CPU’s current operating speed.
You can run a stress test on your CPU by clicking Run CPU test. While the test is running, your Chromebook will likely not be usable and appear frozen at times. The test could take over 5 minutes.
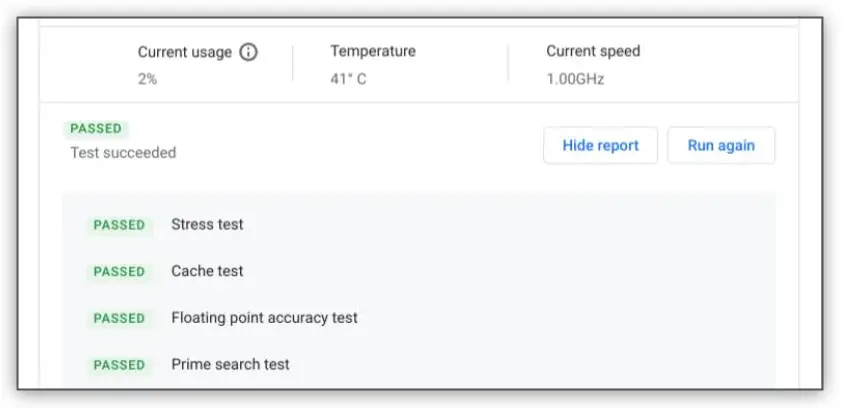
Once the test is complete, you will see similar results to the ones in the image above showing which tests have passed and which have failed.
How To Test Your Chromebook’s Memory
If you think of the CPU as the Chromebook’s brain, then the best analogy is your Chromebook’s memory is its muscle. It can do complex tasks and more tasks at the same time with a larger amount of memory.
Many first-generation Chromebooks had 2 gigabytes (GB) of memory. Most Chromebooks that students currently use have 4 GB of memory. Memory is also referred to as RAM, which is short for Random Access Memory. Higher-end Chromebooks can have 8GB or more RAM.
The Diagnostic Memory test has a real-time view that shows how much Memory you are currently using. This is not hard drive space. Memory is only used while the Chromebook is turned on (or in sleep mode.) If you close tabs, apps, or reboot your Chromebook, you’ll see the amount of memory used go down. The reason my usage is so high in the image below is that I have a ton of Chrome tabs open right now and a few different apps.
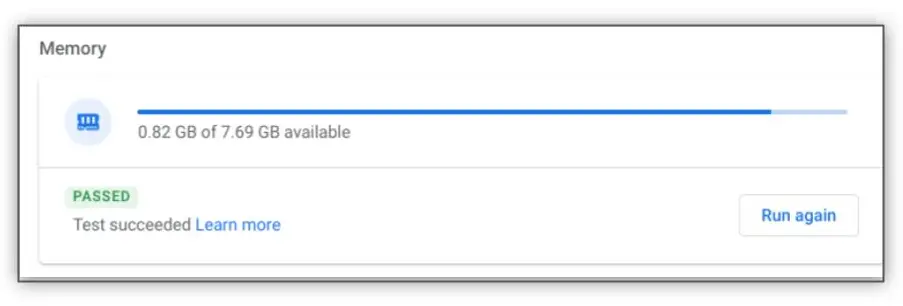
You can run a test on your Chromebook’s memory by clicking Run Memory test. This test takes significantly longer than previous tests, close to 30 minutes. I would not try to use your Chromebook while the test is running, as you will experience performance issues.
How To Test Your Chromebook’s Network Connectivity
The final test included in the Diagnostic tool is the Connectivity test. It has its own section in the tool and you access it by clicking on Connectivity
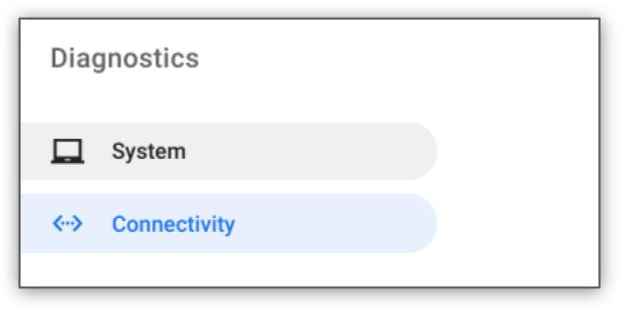
Once you click on Connectivity, the test immediately begins running.
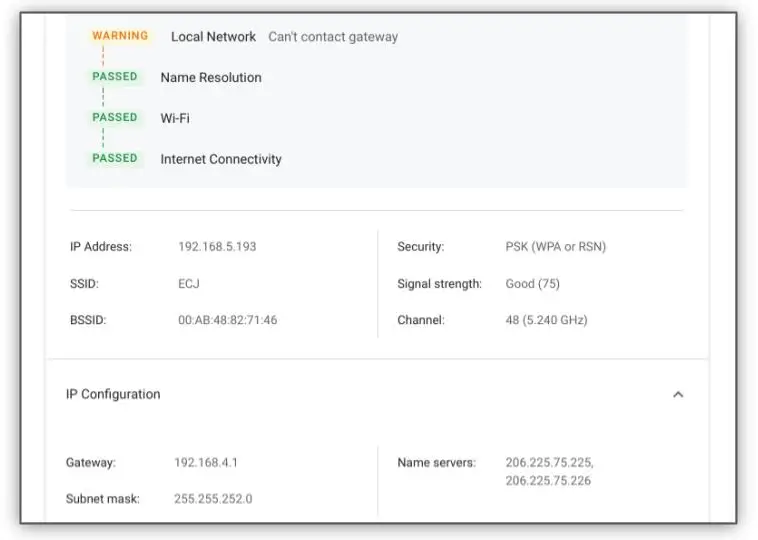
I won’t turn this into an in-depth network class. Below is a high-level explanation of what this report shows.
| IP Address | The network address given to you when you connected to the network. Think of your network as an apartment complex and your IP address as your apartment number. Every user/device on the network must have different IP addresses. |
| SSID | The name of the wireless network you are connected to |
| BSSID | The identified of the access point you are connected to |
| Security | The type of security being used for the wireless connection. |
| Signal strength | 0-100; the strength of the Wi-Fi connection between your Chromebook and the wireless access point you are connected to |
| Channel | Wi-Fi uses either 2.4GHz or 5GHz. 5GHz has less interference, but 2.4GHz travels through walls better |
| Gateway | The IP address of the router you are connected. |
| Subnet mask | Subnets affect how many IP addresses a network can use. |
| Name servers | The IPs you network checks with to make IP addresses to domain names. Usually assigned by your internet service provider. |
Export You Diagnostic Test Results
Your test results are not saved automatically. If you want to save your results to review later or to share with someone, click Save test data. Your results will save to a text file.
